2022 Municipal Election - Context
Context for the 2022 Ontario Municipal Election
There are 444 municipal governments in Ontario, yet only 417 municipal governments hold elections. Why? Because some upper tier municipal governments are populated by a lower tier election process e.g., counties and some regions and one district.
Those 417 municipal governments include:
- All lower-tier municipal governments in a two tier governance structure
- All single-tier municipal governments
- 3 regional municipal governments have a direct election of the Regional Chair at the lower tier (Durham Region, Halton Region, Region of Waterloo)
- 2022 Ontario Municipal Election website
6,306 candidates compete for the 2,860 elected positions up for grabs. 406 of the 2,860 elected officials also sit on the upper tier, for a total of 3,266 seats. In 2022, 692 incumbents did not run compared to 607 in 2018. Unless otherwise noted, all figures and analysis includes City of Toronto.
NOTE: Updated Election Analysis can be found here
CANDIDATES
| 2022 | 2018 | |
| Total number of candidates | 6,306 | 6,658 |
| Total candidates female | 1,931 (31%) | 1,808 (27%) |
Low Candidature:
- This situation is where one or more candidates are acclaimed or the number of candidates running for positions does not exceed two candidates.
- Low candidature occurs in 176 municipal governments (46%) of the 382 municipal governments where voting will occur. (Acclaimed council positions are not included in this figure).
- In other words, in the remaining 206 municipal governments, there are more than 2 candidates per seat to be elected, if the seat is up for election.
Gender:
- Across Ontario, there are more female candidates in 2022 than in 2018. This year, 31% or 1,931 of all candidates are female. This has increased compared to 2018, where 1,808 or 27% of all candidates were female.
- In 2022, the 28 municipal governments with population greater than 100,000, had a ratio of female to male candidates of 30% to 70%, which is marginally lower than province-wide of 31% to 69%.
ACCLAMATIONS
| 2022 | 2018 | |
| Total candidates acclaimed (includes HOC) | 548 (163 female) | 477 (147 female) |
| Total heads of council (HOC) acclaimed | 139 (37 female) | 120 (27 female) |
| Total number of councils fully acclaimed | 32 | 26 |
Acclaimed Candidates
- There has been an increase in the total number of candidates acclaimed. In 2014 there were 390 acclamations; in 2018: 477; in 2022: 548 acclamations.
- Of the 2022 acclaimed, 139 have been acclaimed as Head of Council (Mayor/Reeve). 27% (Mayor/Reeve) are female, up from 23% female in 2018.
- In 2022, number of female candidates acclaimed increased by approximately 11%.
- Of the 548 acclaimed, 380 are incumbent, 46 are incumbent new position (eg councillor running for HOC) and 122 are new candidates.
- The data indicates that there is an increase in female and male acclaimed candidates for both councillors and Head of Council.
Entire Councils Acclaimed:
- In 2014, 18 or 4% of municipal governments in Ontario were fully elected by the acclamation of each council seat. In 2018, that rose to 26 councils or 5%, while in 2022 that rose to 32 or 8%.
- In 2022, the population of the acclaimed municipalities ranges from 92 – 11,091. 22 are from Northern Ontario.
- In terms of population, the smallest in this year’s election is the Village of Thornloe with a population of 92 and the largest is Township of Tay 11,091
Other Acclamations
- 203 municipalities did not have any positions acclaimed
- 179 had one or more positions acclaimed
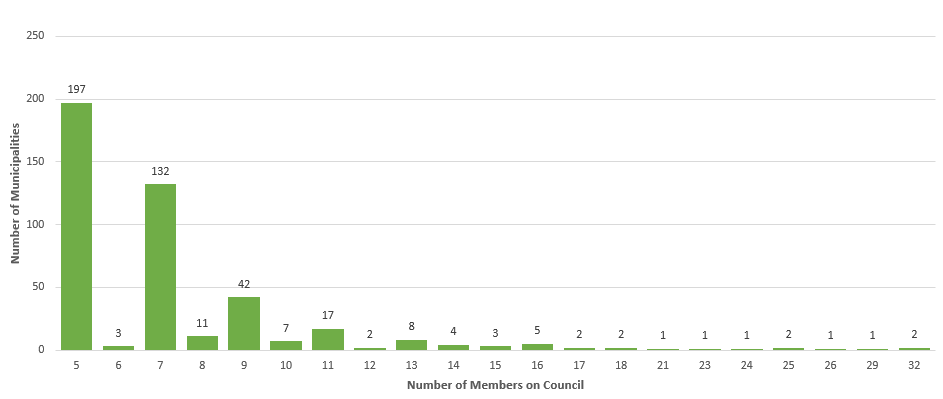
SIZE OF COUNCIL
Size of all 444 Councils varies across the province. The vast majority of councils are composed of five (5) members including the head of council. Larger councils on this chart reflects upper tier councils, such as counties and regions, which are composed of the mayors/reeves of the lower tiers.
For the 2022-26 election, there will be some changes to size:
- Township of Alfred and Plantagenet will reduce size - from 7 members of council to 5, including Head of Council
- Township of Clearview - will reduce size - from 9 members of council to 7, including Head of Council
- County of Dufferin - will increase size - from 14 members of council to 15, including Head of Council (by having 2,545 eligible voters, Township of Melanchton will be sending the Mayor and Deputy Mayor to County Council)
- Municipality of Huron Shores - will reduce size - from 9 members of council to 7, including Head of Council
- City of Ottawa - will increase size - from 24 members of council to 25, including Head of Council
- Town of Penetanguishene - will reduce size - from 9 members of council to 7, including Head of Council
- The Nation Municipality - will increase size - from 5 members of council to 7, including Head of Council.
- City of Vaughan - will increase size - from 9 members of council to 10, including Head of Council. The increase is in 1 more Local and Regional Councillor
- York Region - increased size from 21 to 22, including Regional Chair (in 2018 it was 21, Vaughan increased number of Regional Councillors by 1)
2022-2026 - Size of the Council in Ontario
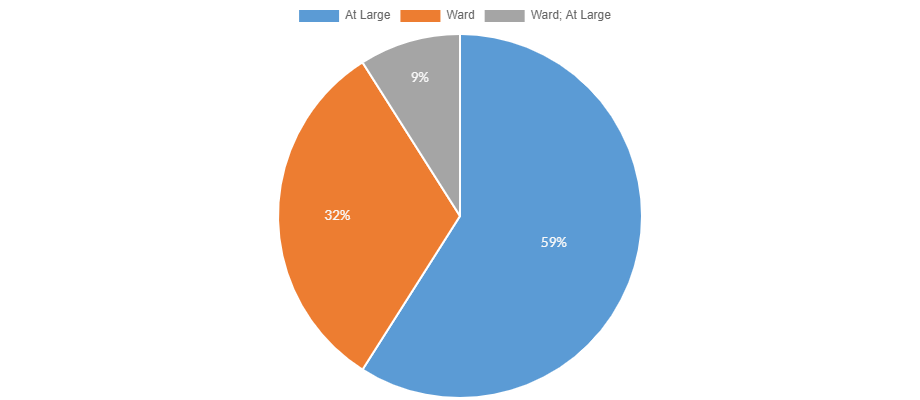
Within a municipal government, its representative structure is either a ward or at-large system and in a few cases, both.
Ward and or At Large Structure
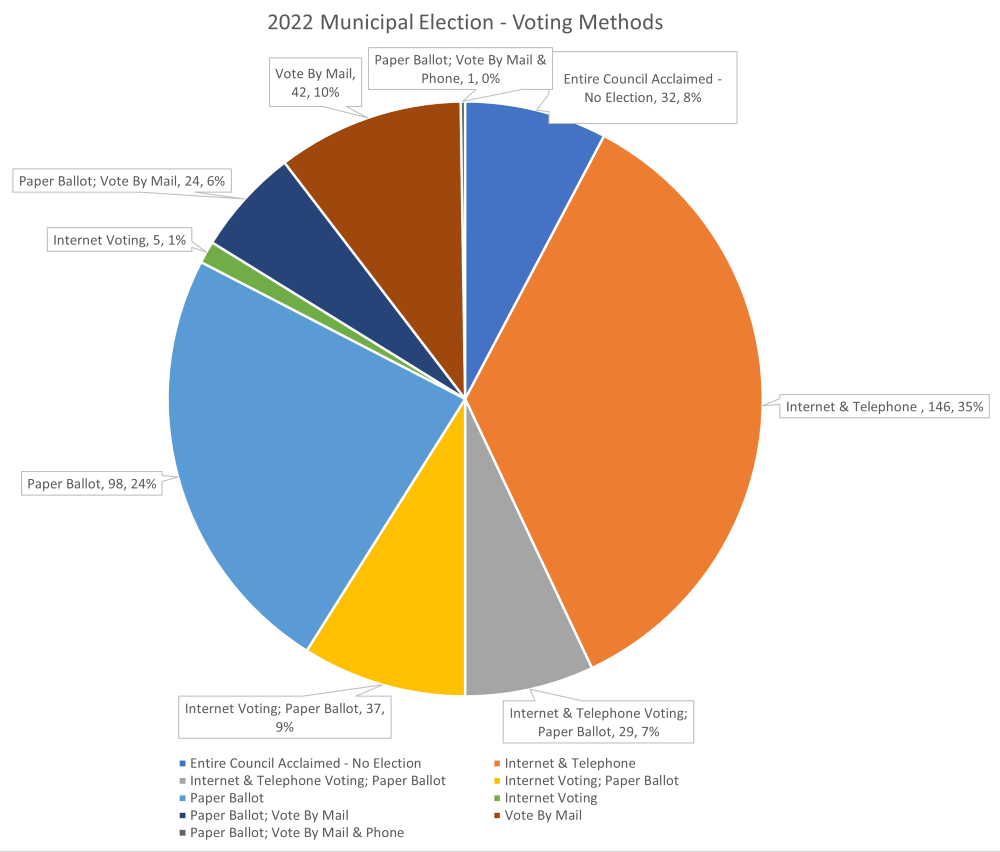
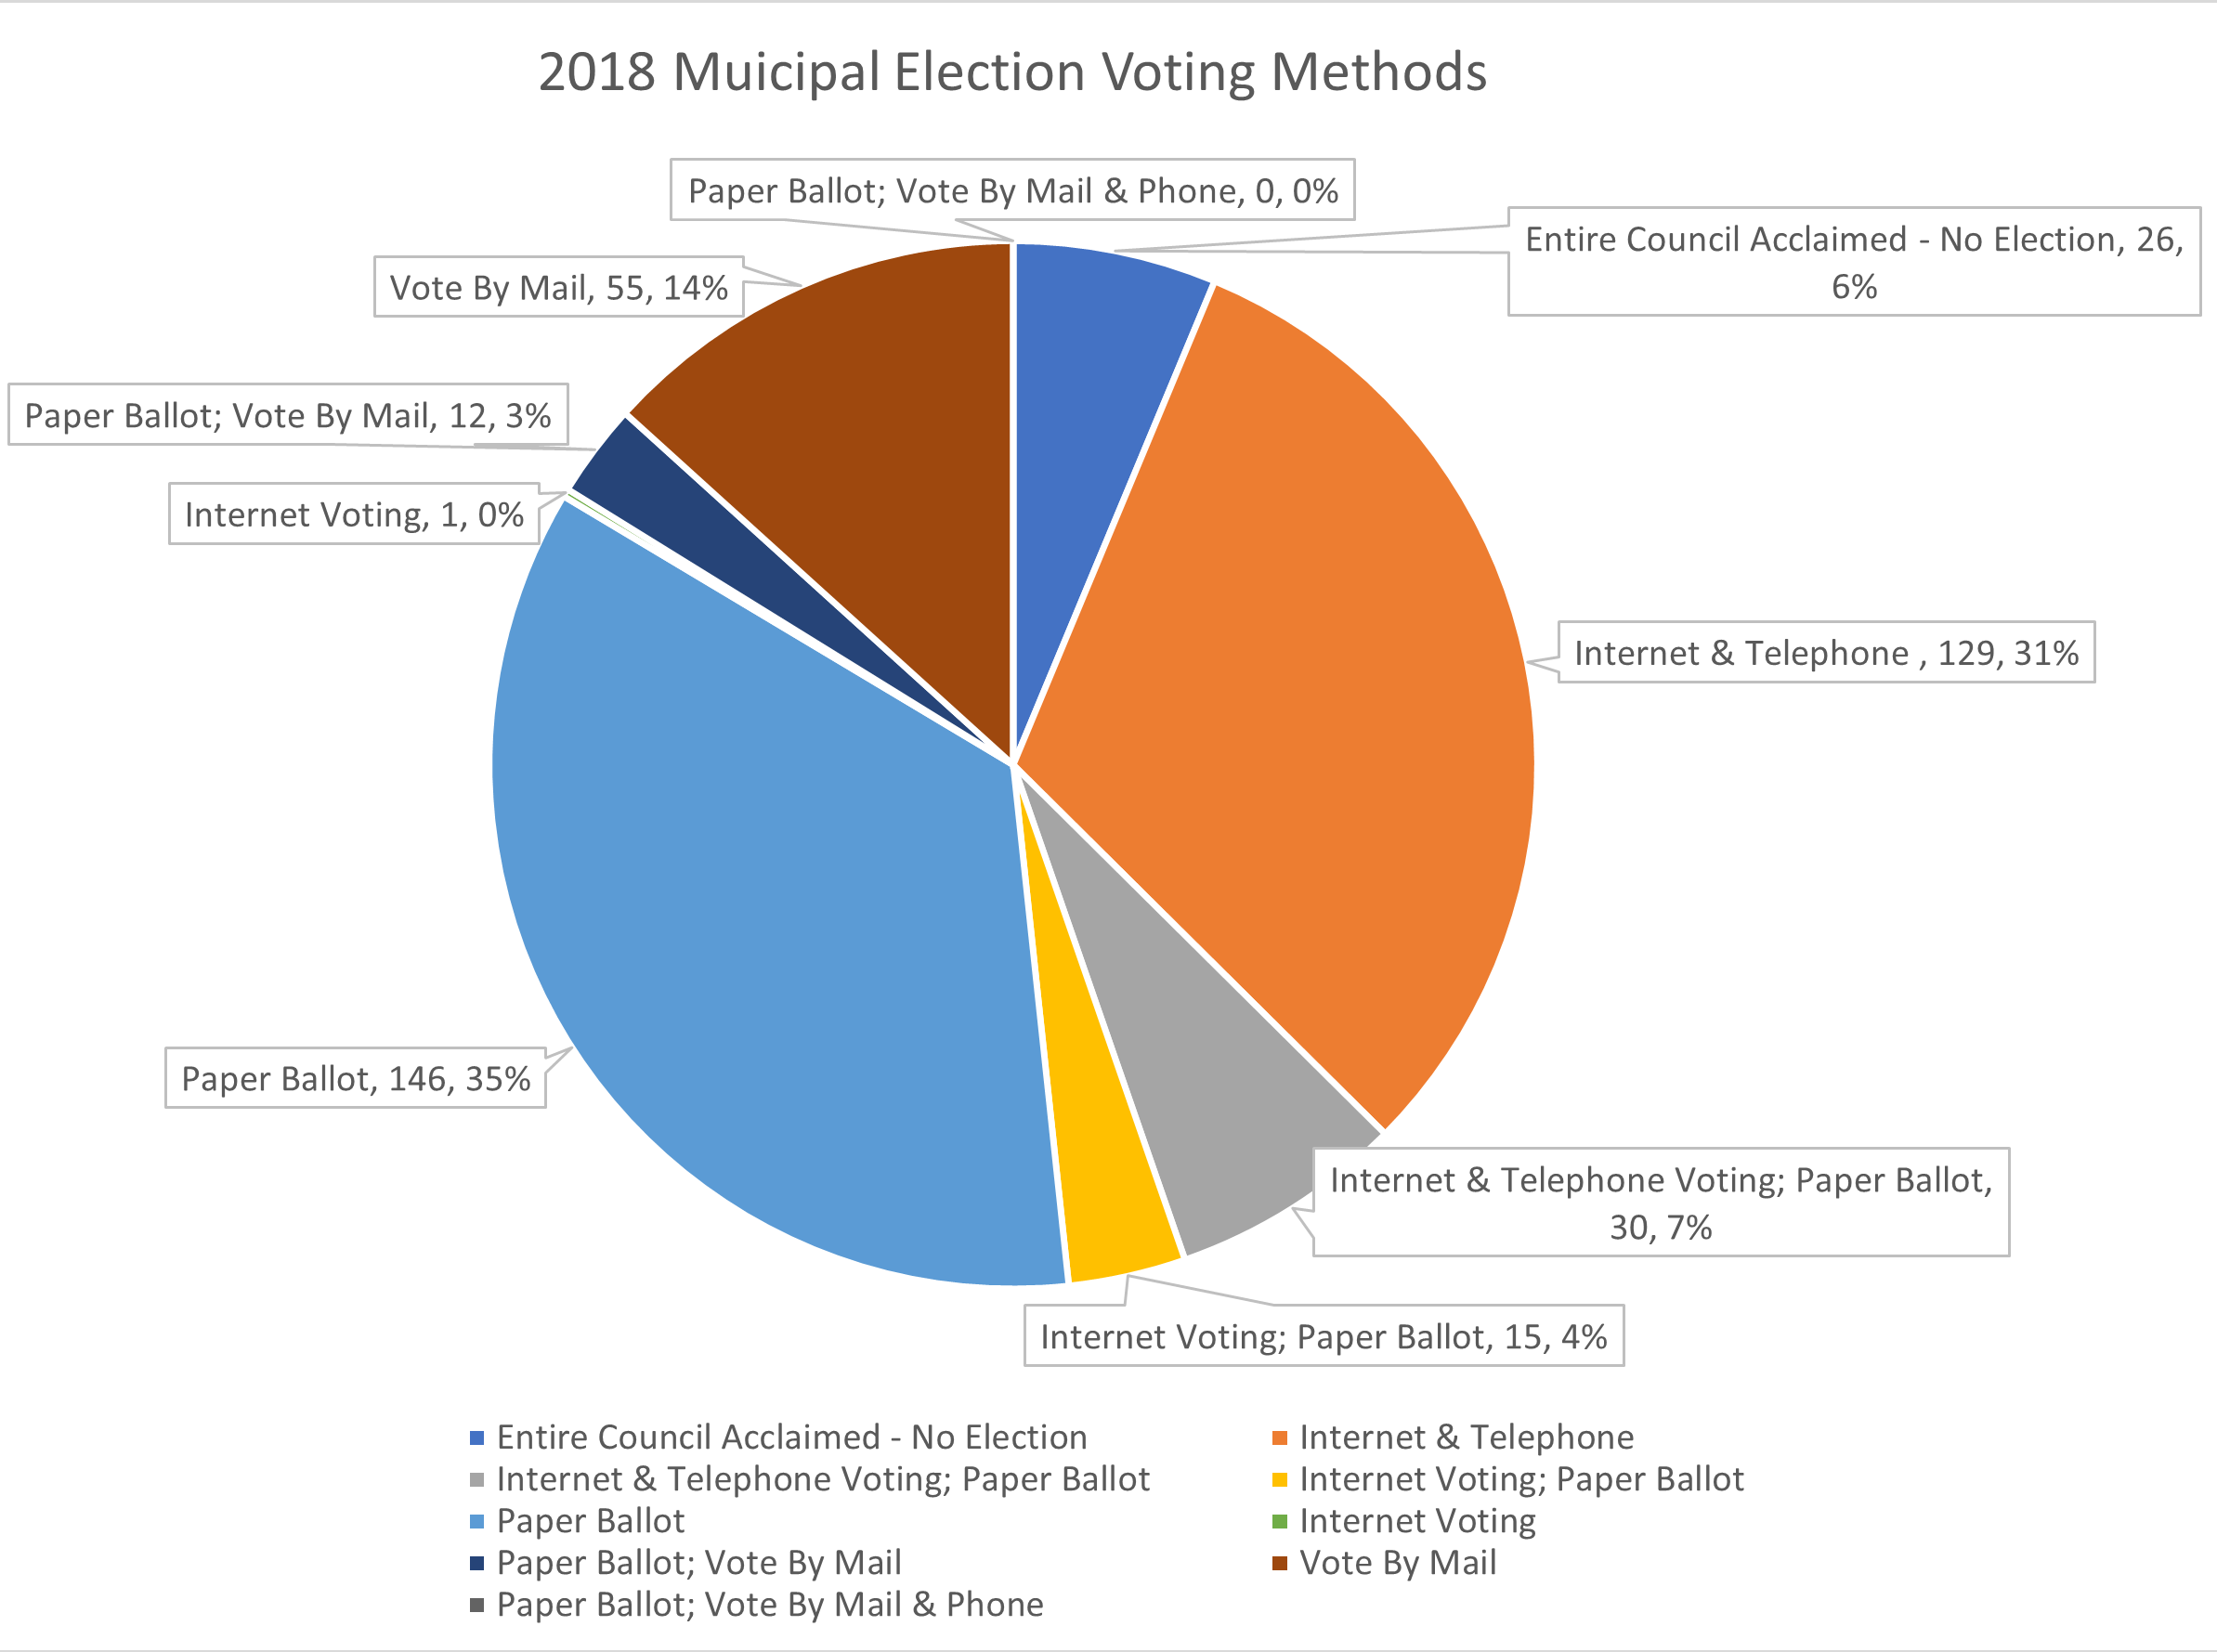
Vote Method
How votes are cast continues to move to technology-based methods. In 2022, 217 municipal governments will use internet and/or phone/combined method, which is 42 more than the 2018 election. The use of mail-in ballots the 2022 election remains the same at 71 municipalities. Charts illustrates the methods used.
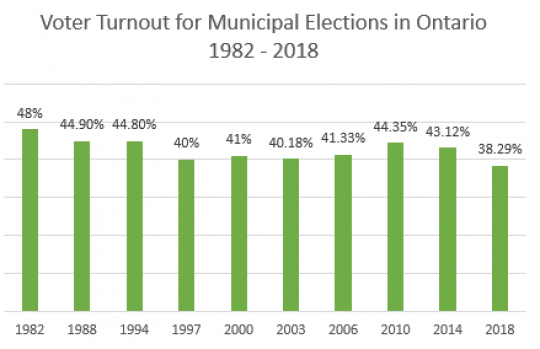
Voter Turnout (Since 1982)
The percentage of turnout has not varied greatly. The highest were 1988 and 1994 at 45% and the lowest was 40% in 1997 and 2003. In 2014, it was 43%. Chart 6 illustrates the turnout over time.
Average Voter Turnout - 1982 to 2018 (Chart 6)
![]()
Disclaimer The Association of Municipalities of Ontario (AMO) has created this election statistics page as a public service. AMO cannot guarantee and assumes no legal liability or responsibility for the accuracy, currency and completeness of the information posted.