2018 Municipal Election Analysis
Election Summary
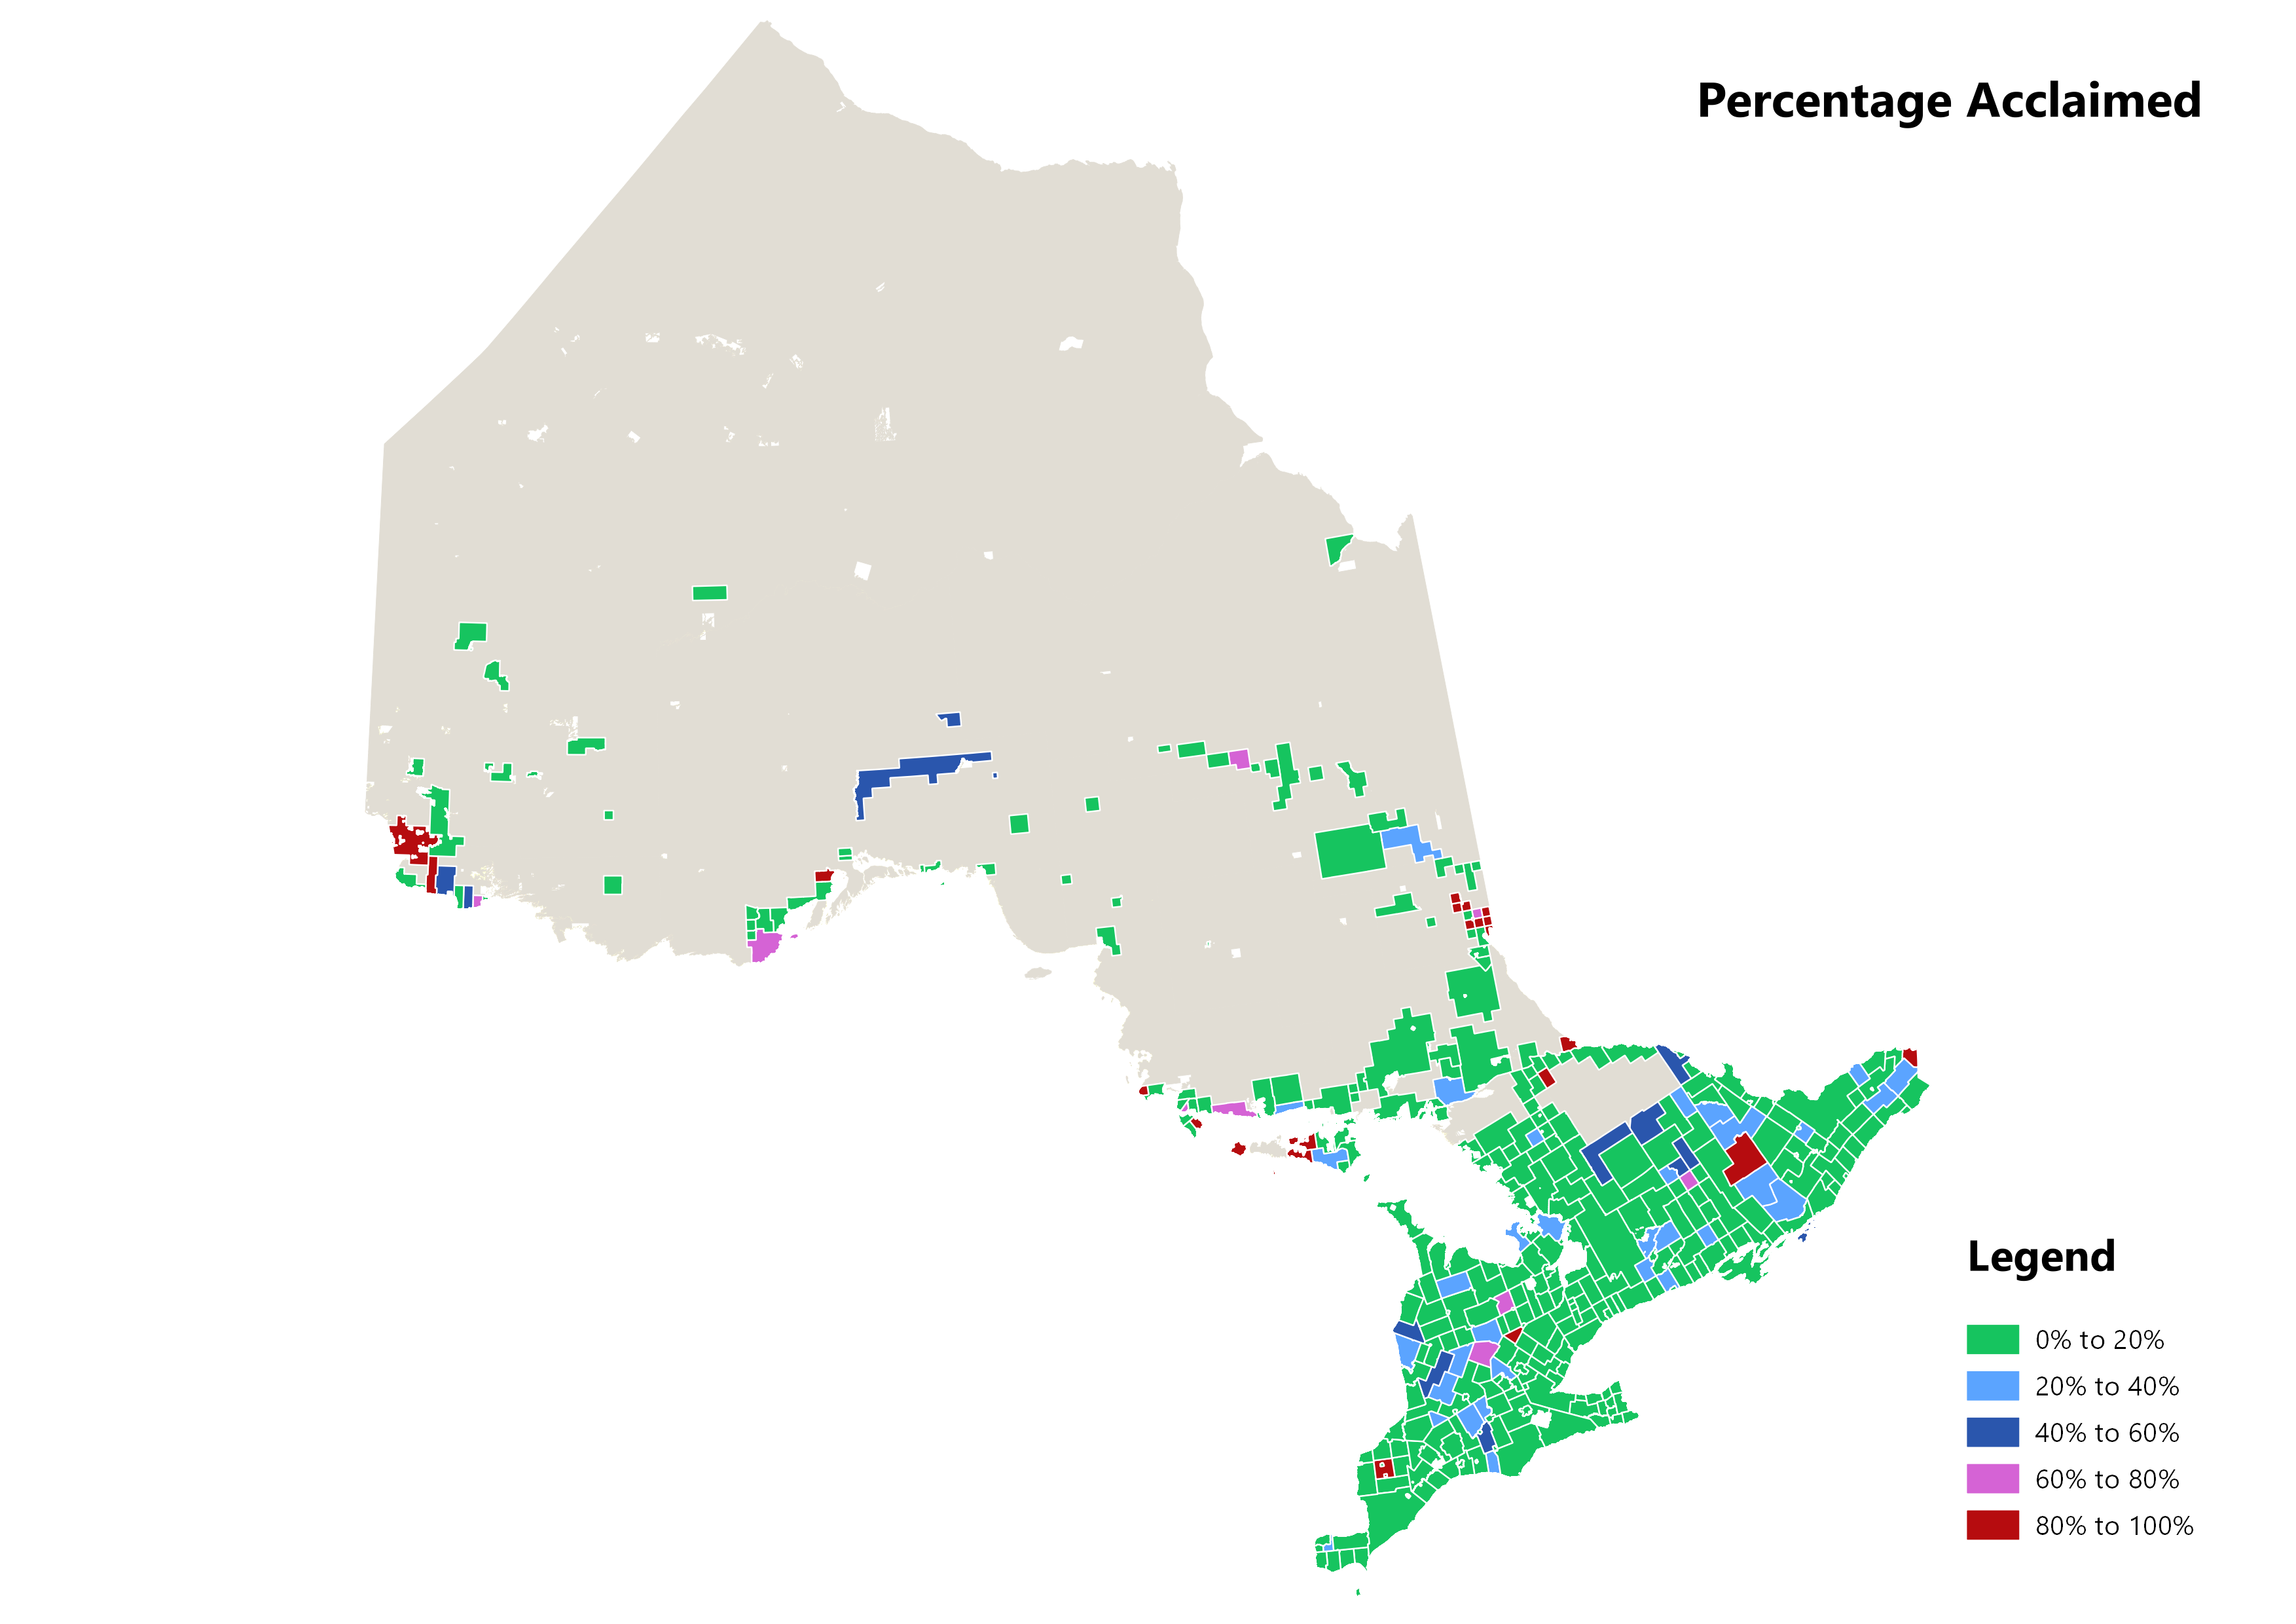
414 municipalities held direct elections in 2018 - 26 of which had their entire council acclaimed. Three upper-tier municipalities had direct elections for the Regional Chair: Halton Region, Waterloo Region and Durham Region at the Region's lower tier municipalities. The candidates for the position of Regional Chair were on the ballot of the lower tier municipality.
6,658 candidates competed for the 2,864 elected positions up for grabs. 406 of the 2,864 elected officials also sit on the upper tier, for a total of 3,270 seats.*
477 positions were uncontested and were therefore acclaimed.
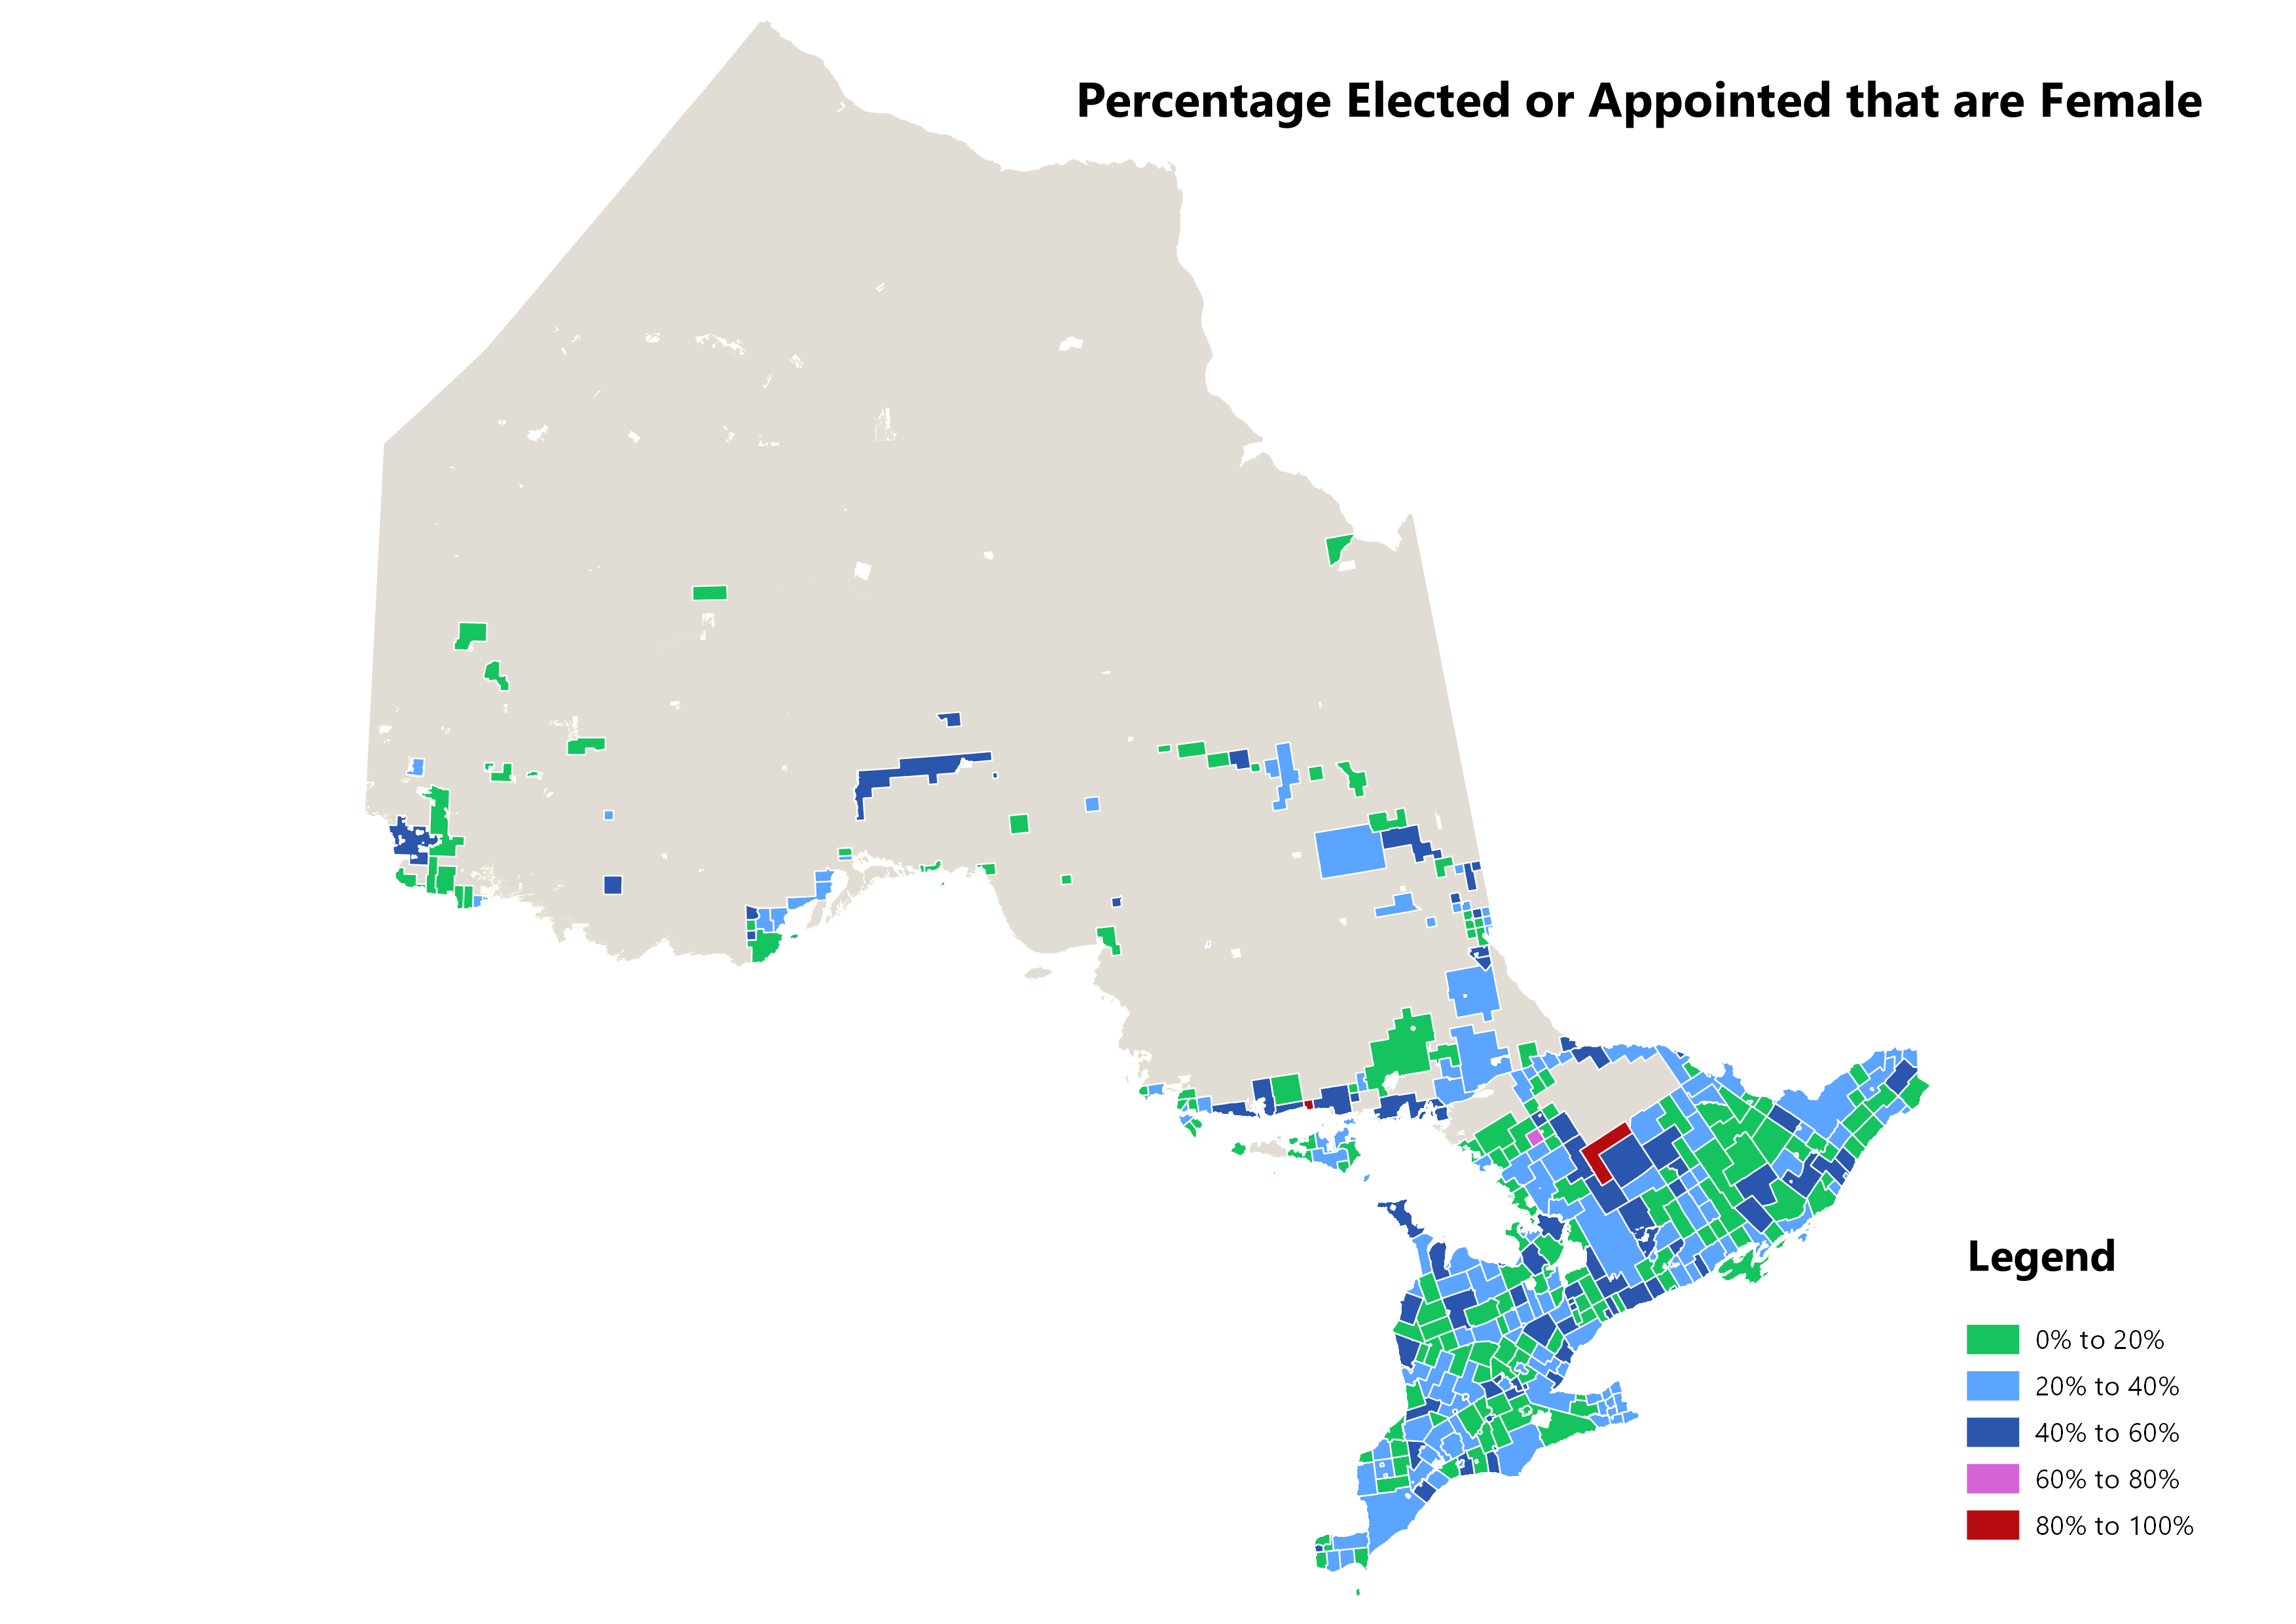
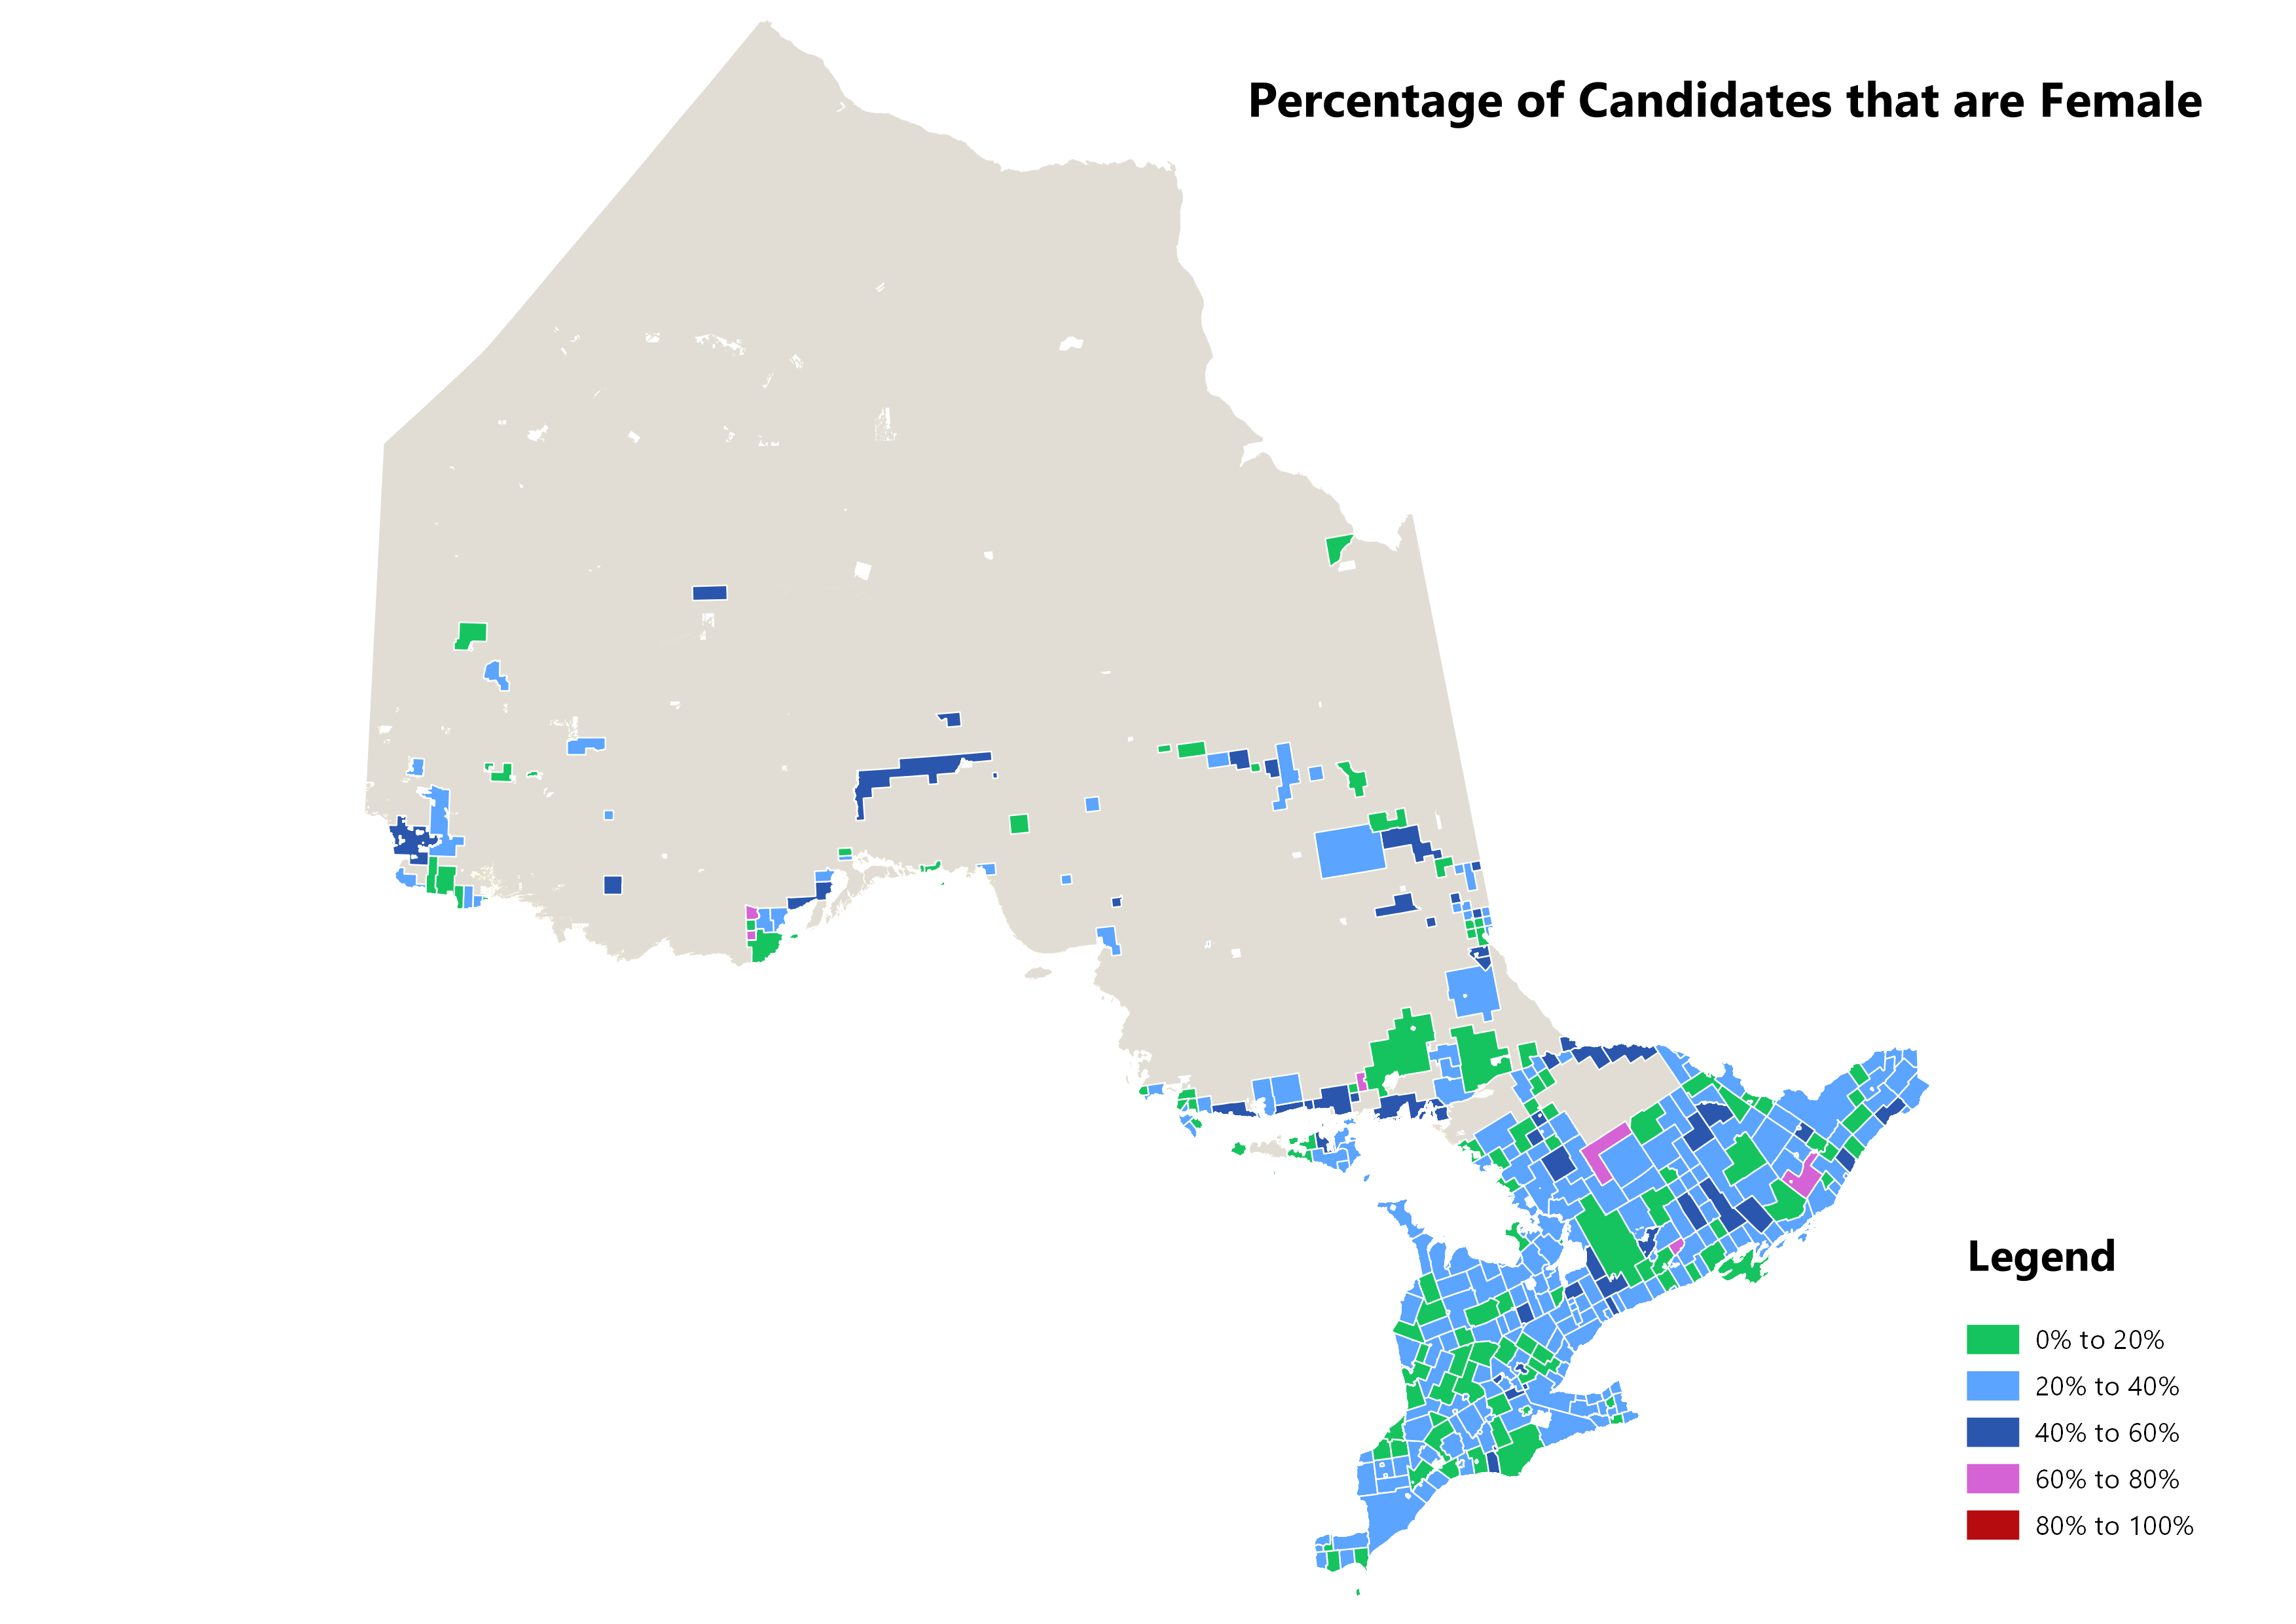
Women comprised 27.2% of candidates – and 29.4% of elected or acclaimed candidates. Incumbents comprised 33.9% of candidates and captured 58.7% of seats available.
WOMEN
1,808 of the 6,658 candidates in this election were women. That’s 27% of the total pool of candidates – and a moderate increase over the 24% seen in the 2014 election.
Women Acclaimed to Office
Of the 477 acclamations, 138 were female. That’s 29% of acclamations, and slightly higher than the percentage of female candidates overall.
Women Elected to Office
Of the 2,366 candidates elected to office, 698 were women. That’s 42% of women running in contested elections. In contrast, 37% of men running in contested elections were successful.
- Total number of females elected as heads of council = 92
- 80 Mayors
- 11 Reeves
- 1 Regional Chair
- Councillors
- 833 councillor seats are held by females*
Women Incumbents
591 of the 2,194 incumbents running were female. This is 27% of the pool of incumbents – and notably the same as the proportion of female candidates in the election.
Success rates of male and female incumbents did not differ substantially.
Success rates of new candidates did seem to differ by gender. Females comprised 1,117 of new candidates participating in contested elections; 354 (30%) were successful. In contrast, males comprised 3,175, and 757 (24%) were successful.
All Women Councils
- Township of Algonquin Highlands and the Town of Spanish elected new councils comprised entirely of women.
Questions on Ballot
4 municipalities had questions on the ballot (City of Cambridge, City of Kingston, Township of Leeds and the Thousand Islands and Town of Wasaga Beach)
Voter Turnout
Average voter turnout was 38.30% (based on 388 municipalities that conducted direct elections and provided voter turnout information)
 |
Success Rates
A candidate’s electoral success depends on the magnitude of her competition, the recognition of her name among the electorate, the size of her war chest, and other factors. Our data cannot account for all of these influences; information below should be interpreted with caution.
Women were slightly more successful than men in Ontario’s 2018 municipal elections (Table 1). Of 1,810 female candidates, 46.4% were successful. In contrast, 41.4% of the 4,846 men running were successful. Two candidates did not have a specified sex in our data; both were unsuccessful.
Incumbents enjoyed a substantial advantage (Table 2). Of 1,939 incumbents running for the same office, 76.5% were successful. Of 318 incumbents running for a different office, 57.5% were successful. In contrast, 26.7% of the 4,401 candidates running for the first time were successful.
Women and men were equally likely to be incumbents. Women nevertheless experienced greater electoral success than men whether running as an incumbent for a new office, an incumbent for the same office, or a new candidate (Table 3).
Turnover Rates
Municipalities experienced an average turnover of 41.5%; new candidates captured 41.3% of seats available. Turnover ranged from 0% in 25 municipalities to 100% in 11 municipalities.
Electoral Results by Gender
Electoral Results by Gender
| Female | Male | Total | |||
| Number | Percentage | Number | Percentage | Number | |
| Acclaimed | 138 | 7.6% | 336 | 6.9% | 474 |
| Elected | 698 | 38.6% | 1,668 | 34.4% | 2,366 |
| Unsuccessful | 974 | 53.8% | 2,842 | 58.6% | 3,816 |
| Total | 1,810 | 100.0% | 4,846 | 100% | 6,656 |
| Note: two candidates without sex data not shown | |||||
Electoral Results by Incumbency
Electoral Results by Incumbency
| Incumbent (Same Office) |
Incumbent (New Office) |
New Candidate |
Total |
||||
| # | % | # | % | # | % | # | |
| Acclaimed | 338 | 17.4% | 33 | 10.4% | 103 | 2.3% | 474 |
| Elected | 1146 | 59.1% | 150 | 47.2% | 1070 | 24.3% | 2,366 |
| Unsuccessful | 455 | 23.5% | 135 | 42.5% | 3228 | 73.3% | 3,816 |
| Total | 1,939 | 100.0% | 318 | 100.0% | 4,399 | 100.0% | 6,656 |
Elected Candidates by Incumbency and Sex
Elected Candidates by Incumbency and Sex
| Elected Females | Elected Males | Total | |||
| Number | Percentage | Number | Percentage | Number | |
| Incumbent (Same Office) | 305 | 73.5% | 841 | 70.9% | 1,146 |
| Incumbent (New Office) | 49 | 52.7% | 101 | 52.6% | 150 |
| New Candidate | 344 | 29.6% | 726 | 23.2% | 1,070 |
| Total | 836 | N/A | 2,004 | N/A | 2,840 |
| Note: (two candidates without sex data not shown). Percentages are expressed in terms of the number of candidates of the specified sex and incumbency that competed in a contested election (e.g., 73.5% of female incumbents running for the same office were elected, not including acclaimed candidates). | |||||
Map - Percentage Acclaimed
Map - Percentage Female Candidates
Map - Percentage Female Elected or Appointed