2018 Municipal Election - Fast Facts
Context for 2018
There are 444 municipal governments in Ontario, yet only 417 municipal governments hold elections. Why? Because some upper tier municipal governments are populated by a lower tier election process e.g., counties and some regions and district)
Those 417 municipal governments include:
- All lower-tier municipal governments in a two tier governance structure
- Three regional municipal governments which include direct elect Chairs
- All single-tier municipal governments
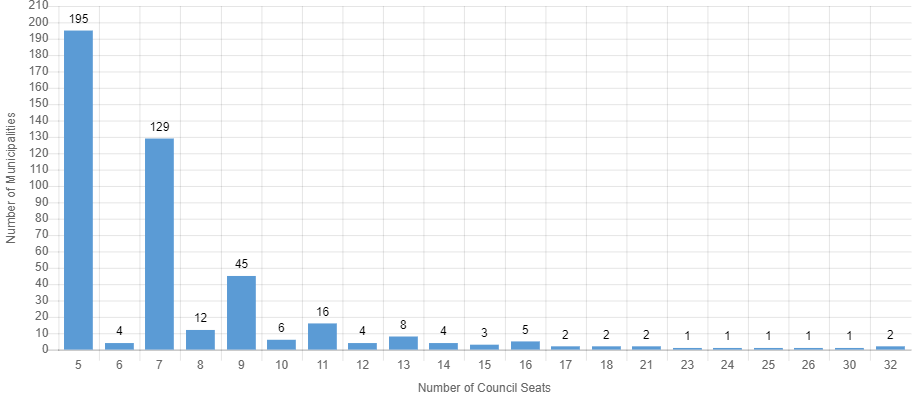
Size of all 444 Councils varies across the province. The vast majority of councils are composed of five (5) members including the head of council. Larger councils on this chart reflects upper tier councils, such as counties and regions, which are composed of the mayors/reeves of the lower tiers. Toronto’s new size is included. See Chart 1.
2018 - Size of the Council in Ontario (Chart 1)
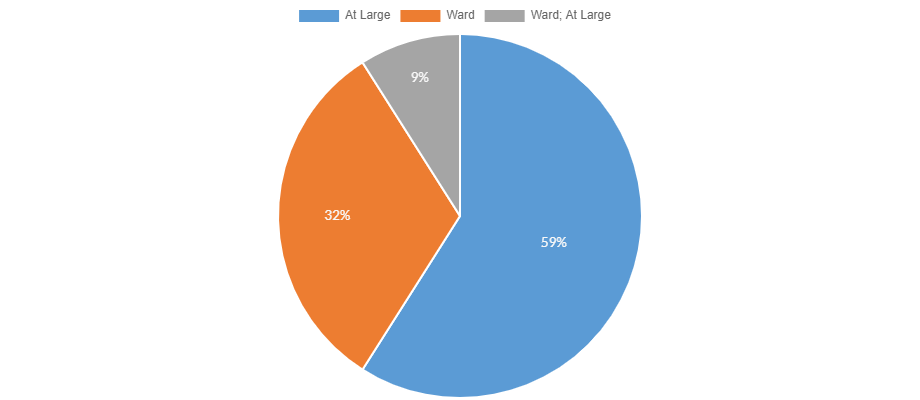
Within a municipal government, its representative structure is either a ward or at-large system and in a few cases, both. Chart 2 shows the percentage.
2018 - Ward and or At Large Structure (Chart 2)
Candidates
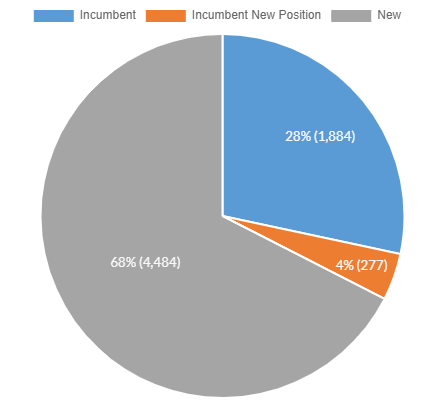
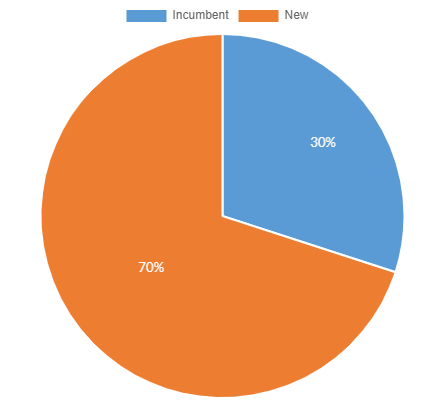
There are a total of 6,645 people on municipal ballots. 28% are incumbents running for the same position on council they currently hold. 4% are incumbents but running for a different position on council. Across Ontario, 67% (4,483) candidates who are not sitting members of a council. Chart 3a shows 2018 incumbency rate and Chart 3b shows 2014.
2018 - Incumbency Rate (Chart 3a)
2014 - Incumbency Rate (Chart 3b)
477 of candidates have been 'deemed to be elected by acclamation'. In other words, no one ran against them, so no election for that council seat will happen. 120 of these acclaimed candidates are heads of council positions (e.g., mayor or reeve). In 26 municipalities (5%), all the seats on a council were uncontested so the entire council was acclaimed. That does not necessarily mean that it is only incumbents that were acclaimed. 111 New candidates have also been acclaimed.
Gender
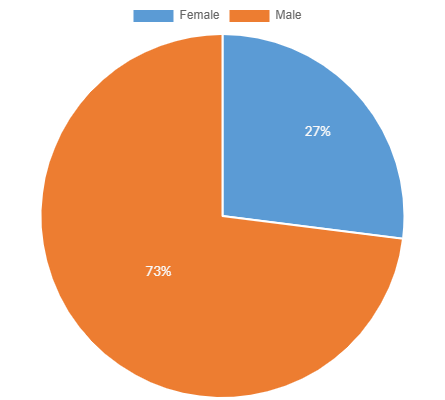
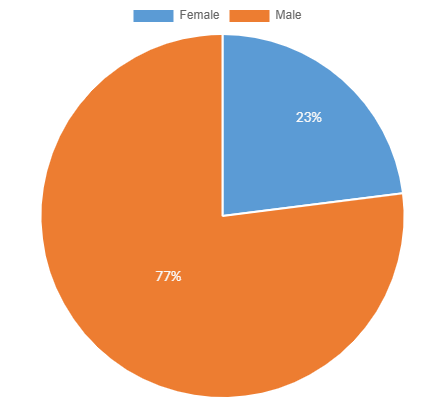
Across Ontario, 27% of all candidates (running or acclaimed) are female which is an increase from 2014 (23%). 20% of the female candidates are running for head of council positions. See Chart 4a for 2018 and Chart 4b for 2014. 23% of 120 acclaimed candidates for heads of council are female.
2018 - Gender (Chart 4a)
2014 - Gender (Chart 4b)
Vote Method
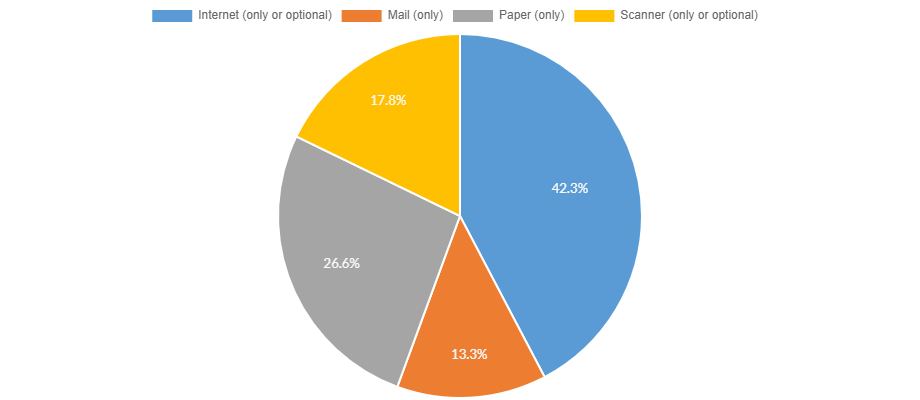
How votes are cast continues to move to technology-based methods. 178 municipal governments will use internet/phone method, which is 84 more than the previous election. The use of mail-in ballots this election has dropped by 46% and likely reflects a move to a method that is safe from a postal strike. Chart 5 illustrates the predominant methods used.
2018 - Vote Methods (Chart 5)
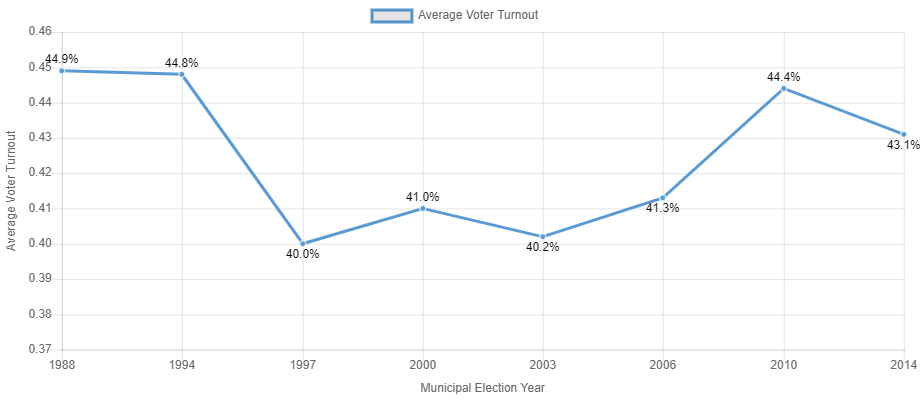
Voter Turnout (Since 1988)
The percentage of turnout has not varied greatly. The highest were 1988 and 1994 at 45% and the lowest was 40% in 1997 and 2003. In 2014, it was 43%. Chart 6 illustrates the turnout over time. We will post 2018 voter turnout as soon as we get the information from the returning officers.
Average Voter Turnout - 1988 to 2014 (Chart 6)